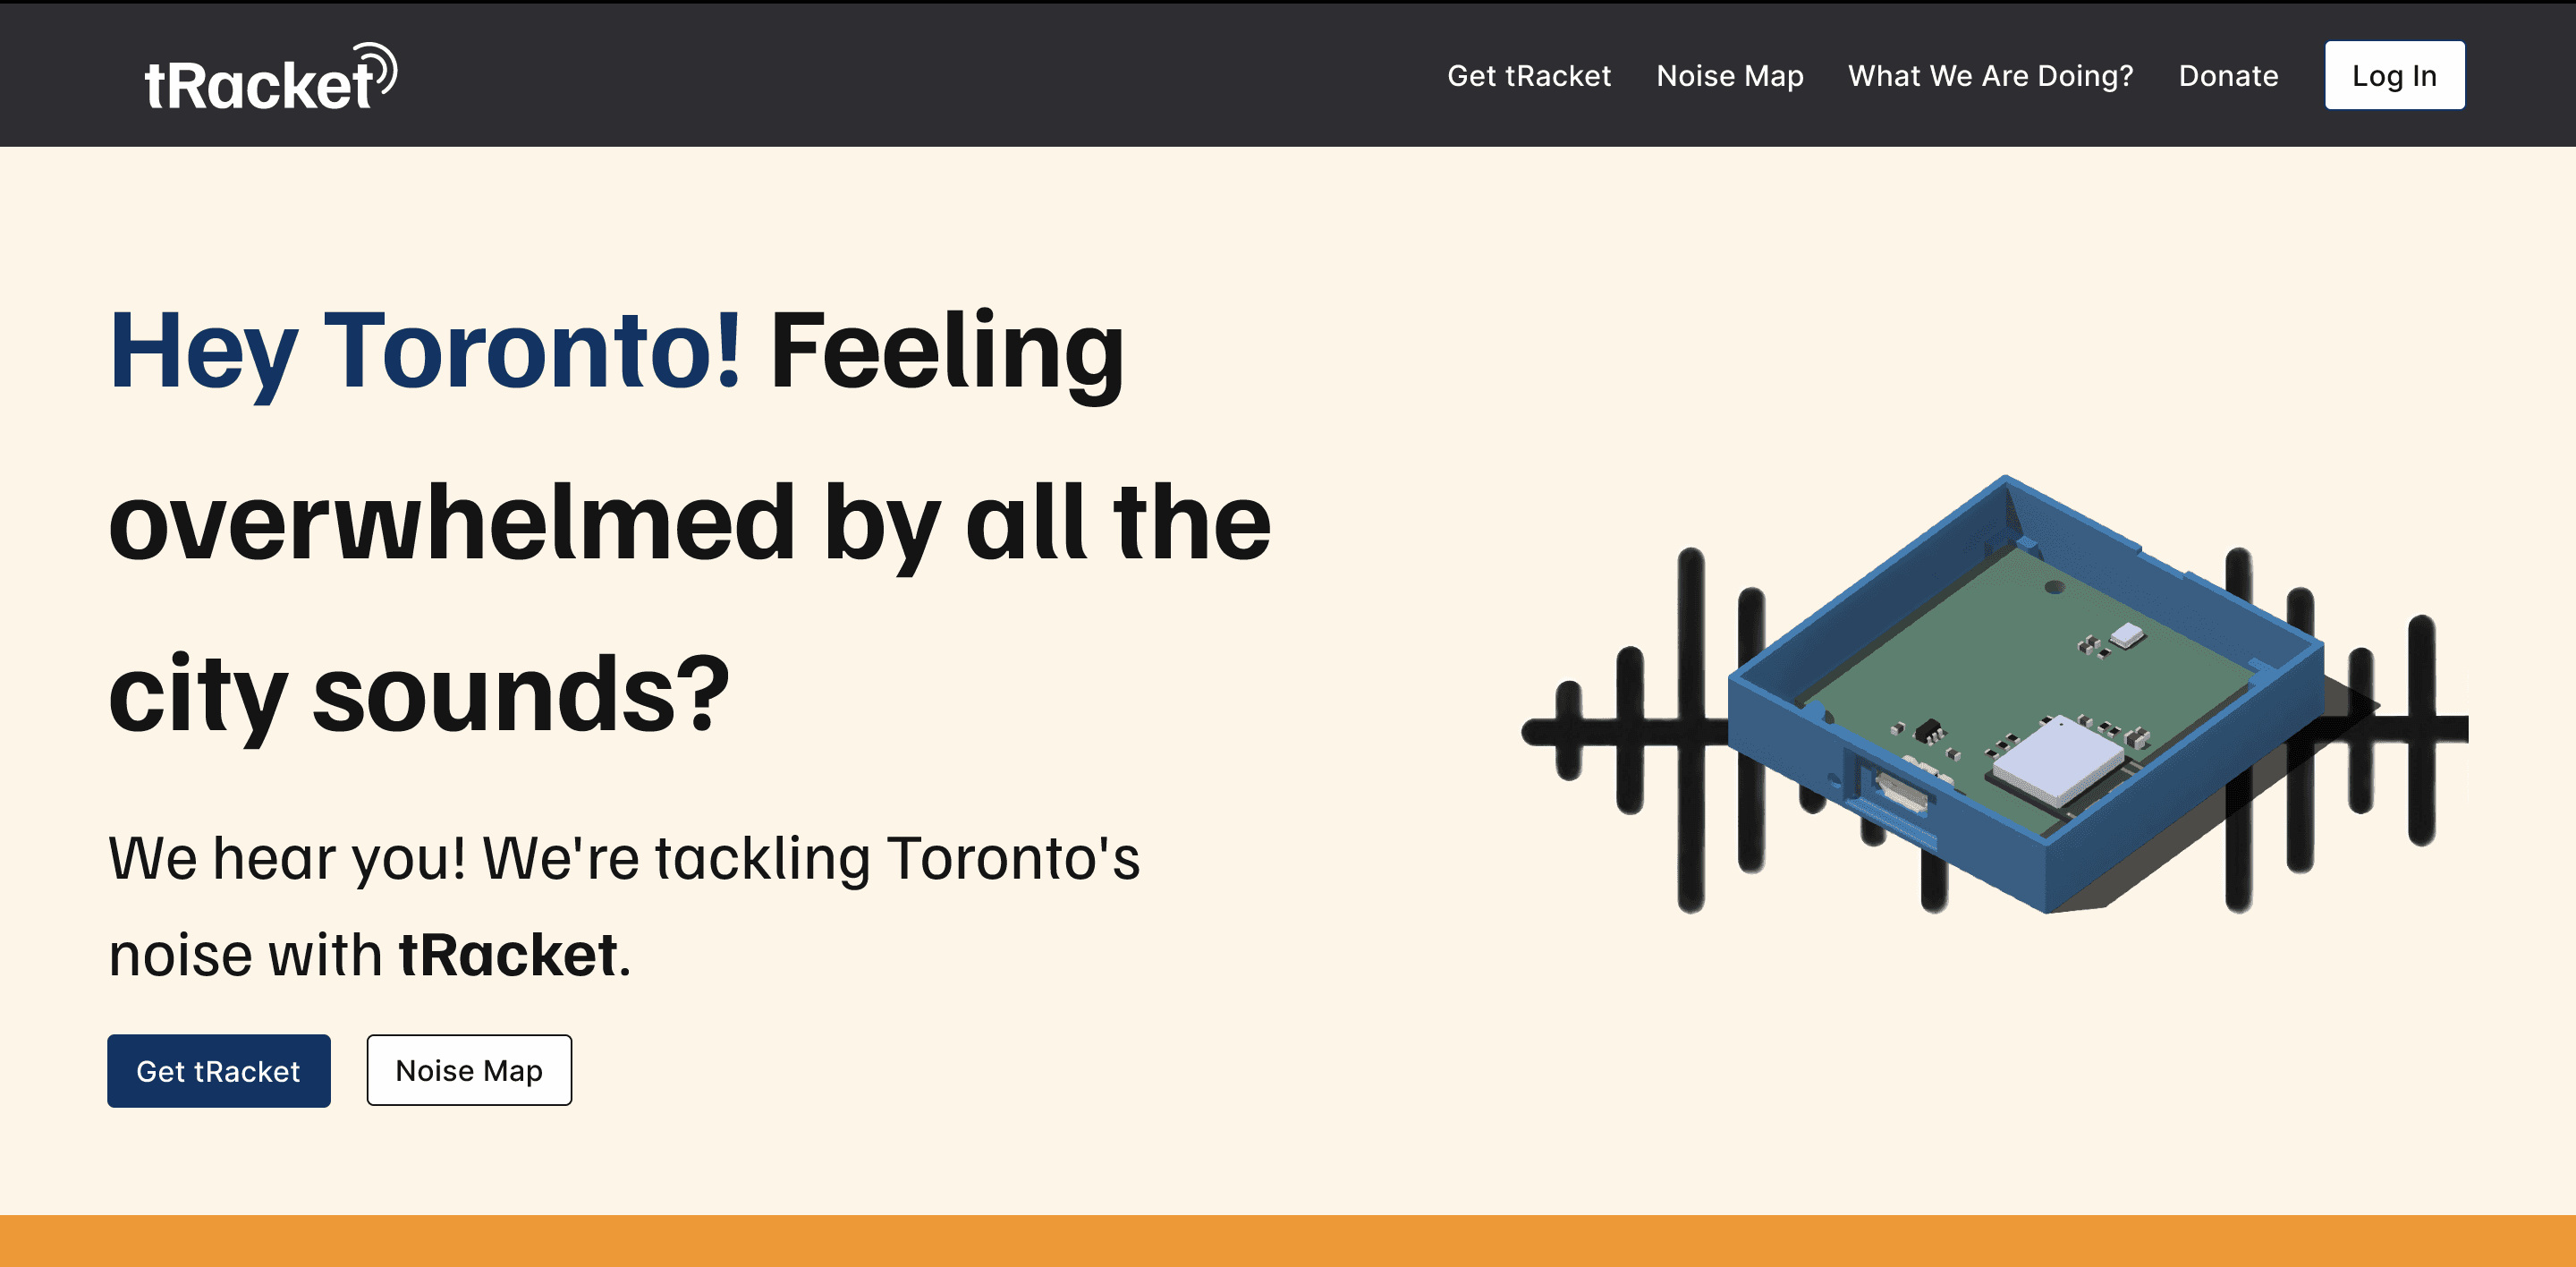
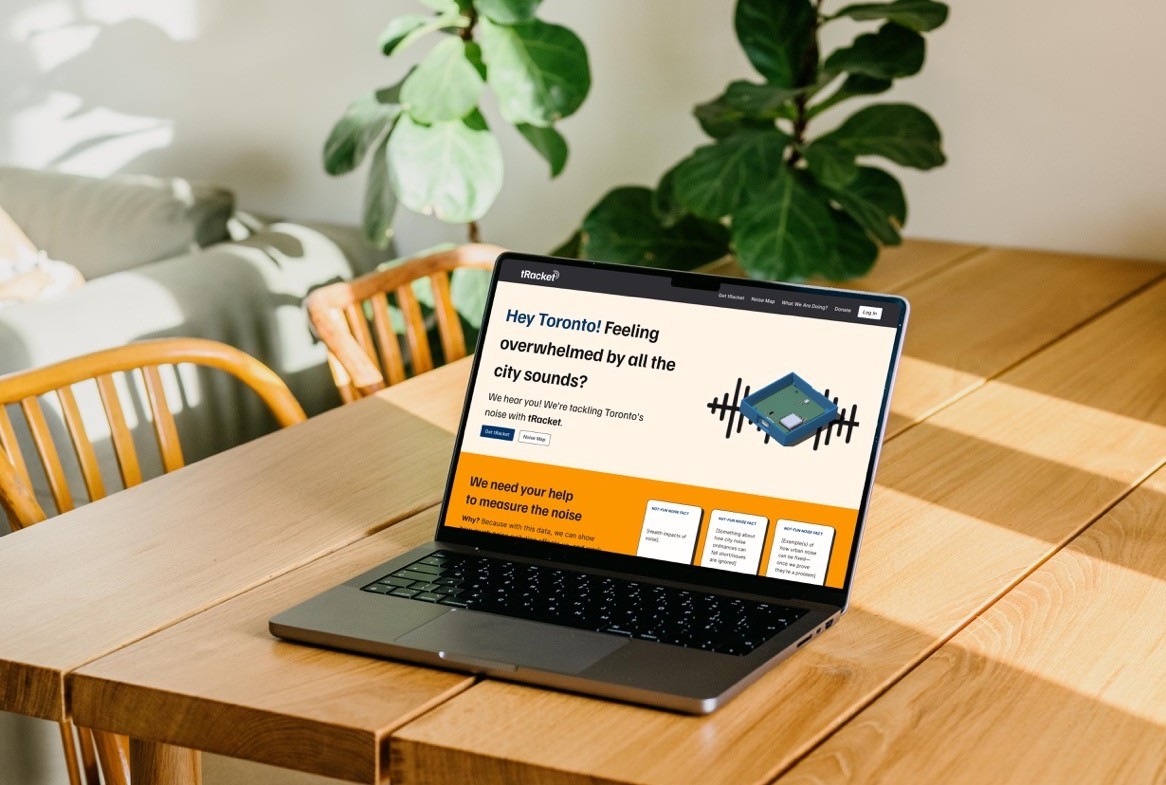
tRacket | Noise Meter for Torontonians
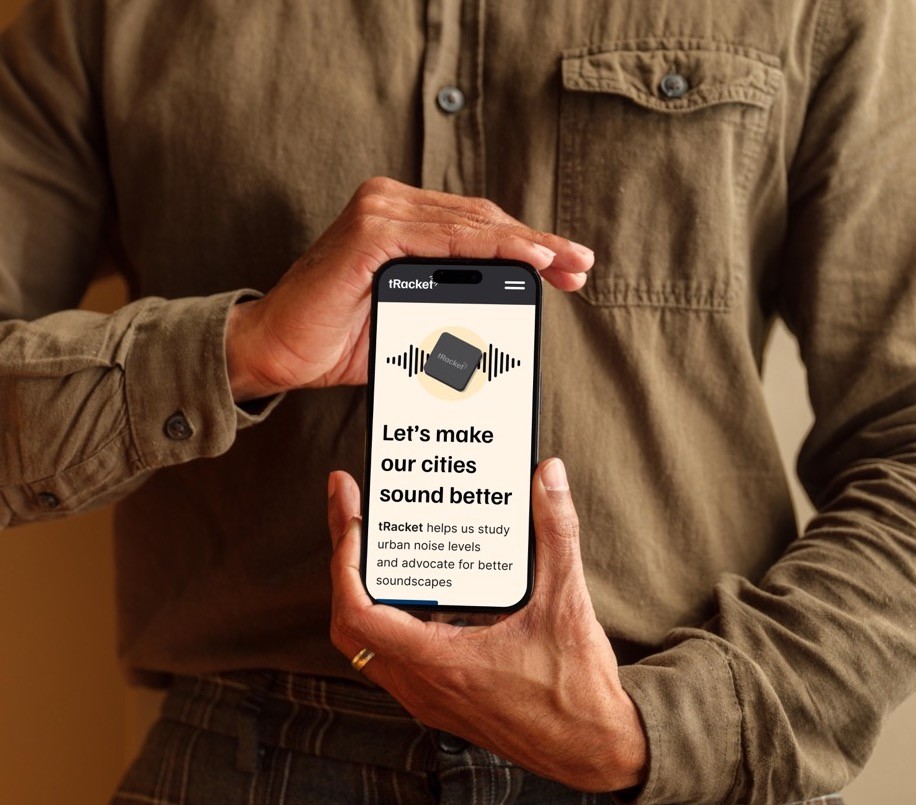
Urban noise is a public health issue and tRacket helps study urban noise levels and advocate for better soundscapes. With this data, we can show how much noise pollution affects us, and work towards quieter streets and clearer laws.
Civic Tech Toronto, a vibrant and diverse community of Torontonians established in 2015, harnesses technology, design, and innovation to tackle civic challenges. tRacket is one of the projects created by Civic Tech TO volunteers.
My role
Product Designer
Team
Product Designers
Content Designers
Product Managers
Data Scientists
Front/Back-end Developers
System Engineers
Target Users
Urban noise reduction advocates — care about using collected data to advocate for better policy and enforcement.
Device owners — care about the data collected by their device, and the operation of their device.
Started with a Problem
Toronto lacked a publicly available source of up-to-date noise data. To address this gap, we created a public website that displays real-time noise levels collected by sensors in various neighborhoods. Following that, the website :
Enables people to find, see and understand noise data collected by noise sensors.
Enables people to use noise data, collected by sensors, for advocacy for policy change and better enforcement.
Ingrid Buday, the founder of No More Noise Toronto, is advocating for reduced noise in our cities, which is mostly created by vehicles and motorcycles. She brought this topic to Civic Tech TO and was key in starting this project.
What was my role based on defined problem statements?
Led UX Research to Prototypes
As a Product Designer, I took the initiative and kicked off the user research phase to gain a deep understanding of user needs, competitors, and stakeholders' goals.
I then collaborated with fellow designers and developers to iterate through sketches and wireframes, and ultimately create high-fidelity prototypes for user testing.
Decisions Behind the Product
UX Research
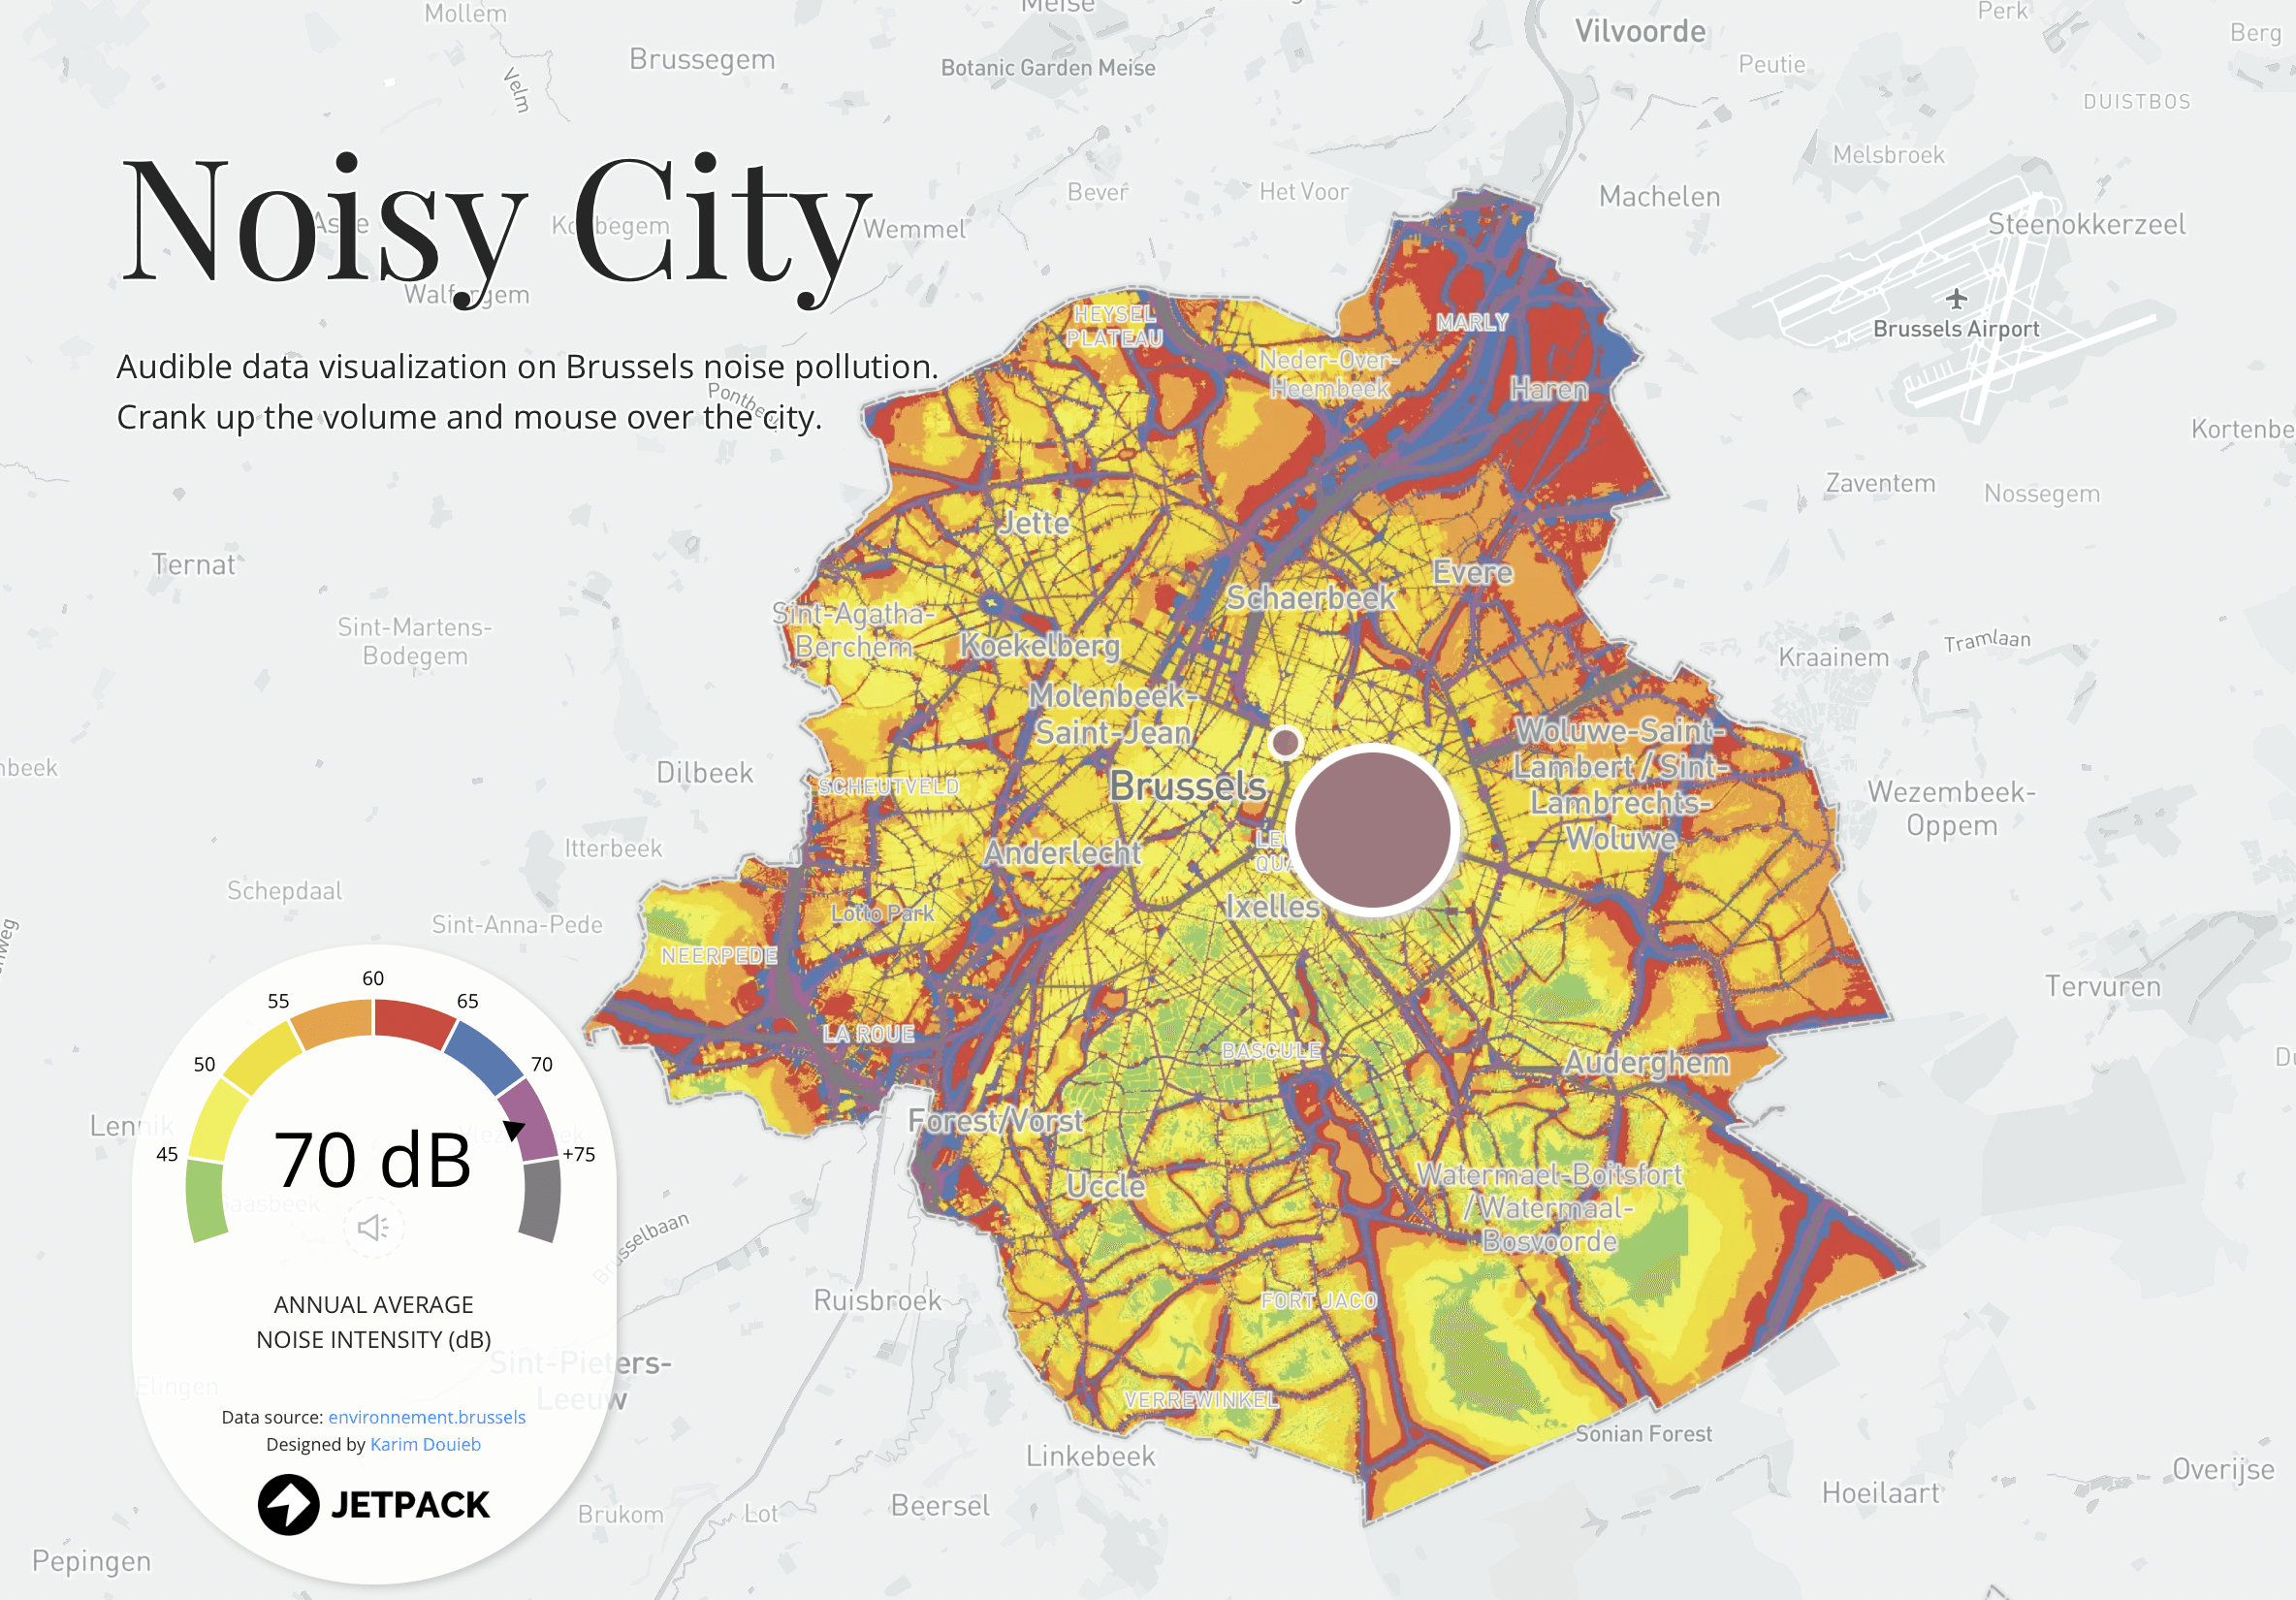
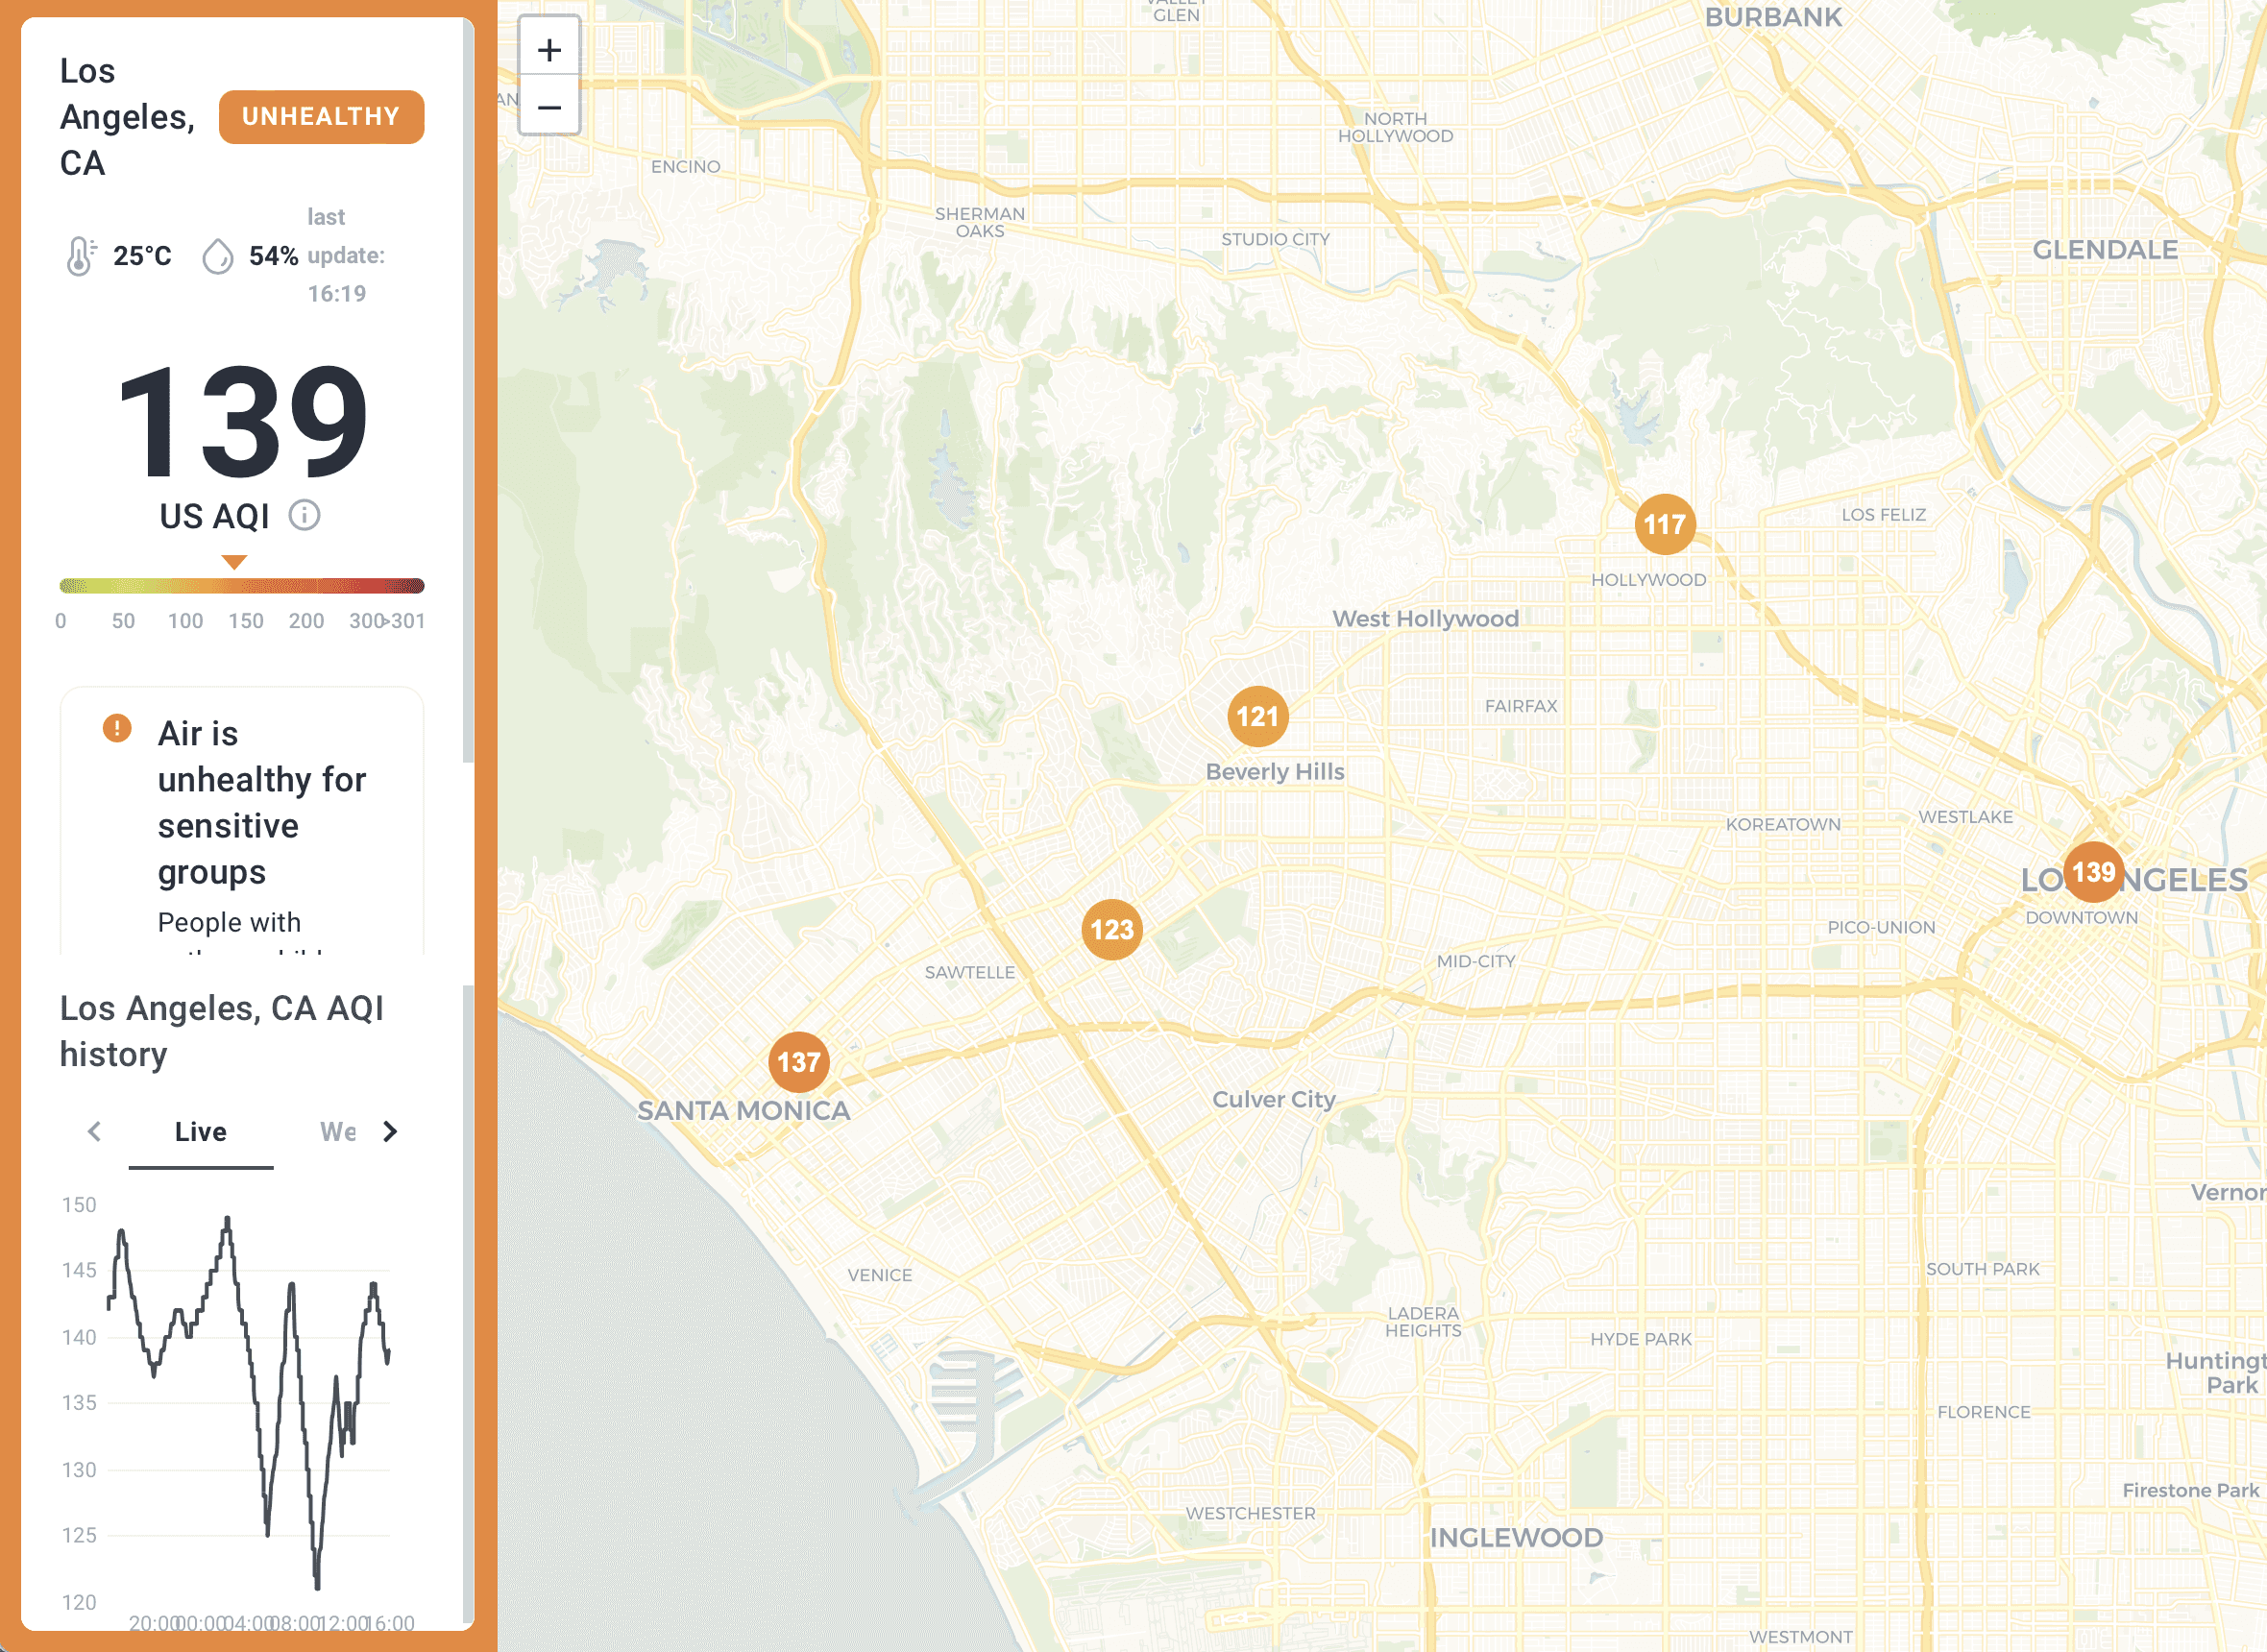
Competitor Analysis — SWOT + User Journeys
Joining the noise meter project, my first question was, "What are the others doing?" Unfortunately, the answer was unclear due to a lack of prior research.
Taking the initiative, I began UX research by first conducting a competitor analysis. My main focus was on their SWOT analyses and user journeys. I shared the report with the team, who were impressed by it.
Stakeholder Interviews — Insights from the Founder
The UX research report helped us create a roadmap for developing the first public website for noise monitoring in Toronto.
To make product better, I prepared key questions to understand their core concerns, focusing on specific pain points and desired outcomes.
This approach allowed us to tailor data collection and presentation to their needs, address potential roadblocks, and build trust. Additionally, it helped identify gaps in existing systems.
Decision Process
Privacy?
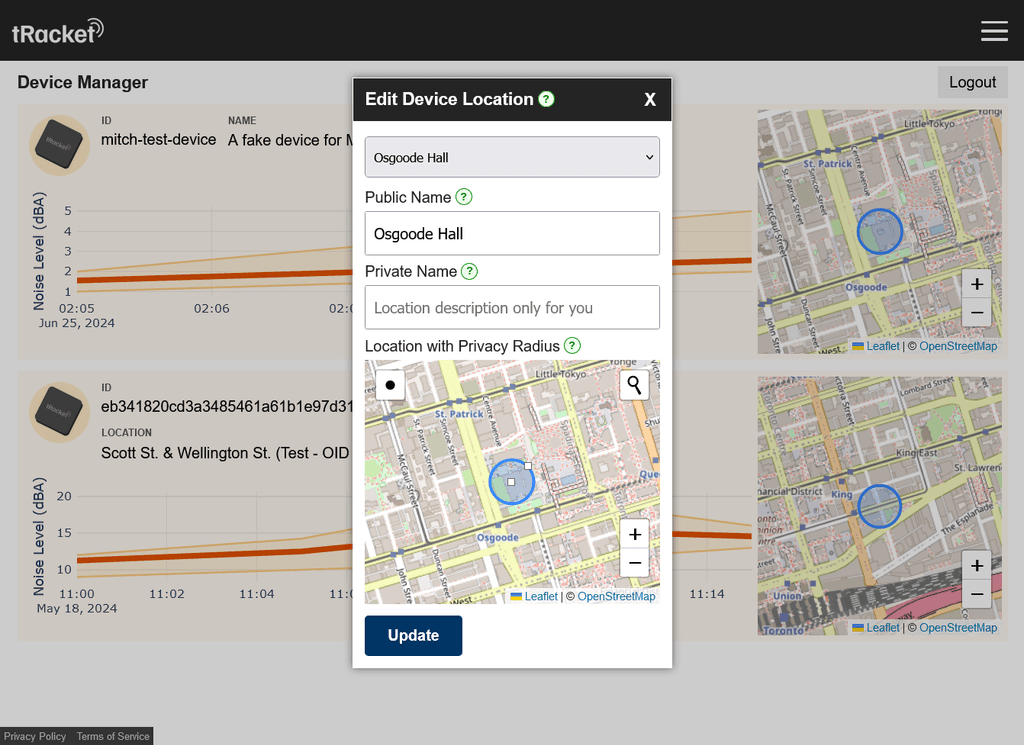
Privacy was a major concern for both us and our users. To address this, we don't ask for exact locations. Instead, we offer options for users to specify their location, such as by entering an intersection.
Taking the initiative, I began UX research by first conducting a competitor analysis. My main focus was on their SWOT analyses and user journeys. I shared the report with the team, who were impressed by it.
Additionally, we've made our privacy policy publicly available, so users can easily access information about privacy at tRacket.
Are heat maps good idea?
Our competitor analysis revealed that heat maps are a common way to visualize pollution. However, this approach wasn't ideal for us due to our limited number of sensors.
Instead, we opted for small circles to represent approximate locations and the number of devices at those locations. This approach prioritizes noise data visualization.
Website or App?
Since our primary goal is to empower users to find, see, and understand noise levels, we prioritized simplicity and accessibility. While we considered developing a mobile app, our volunteer group's budget limitations led us to focus on a website.
This approach allows us to reach a wider audience and have a greater public impact.
Sketches & Wireframes
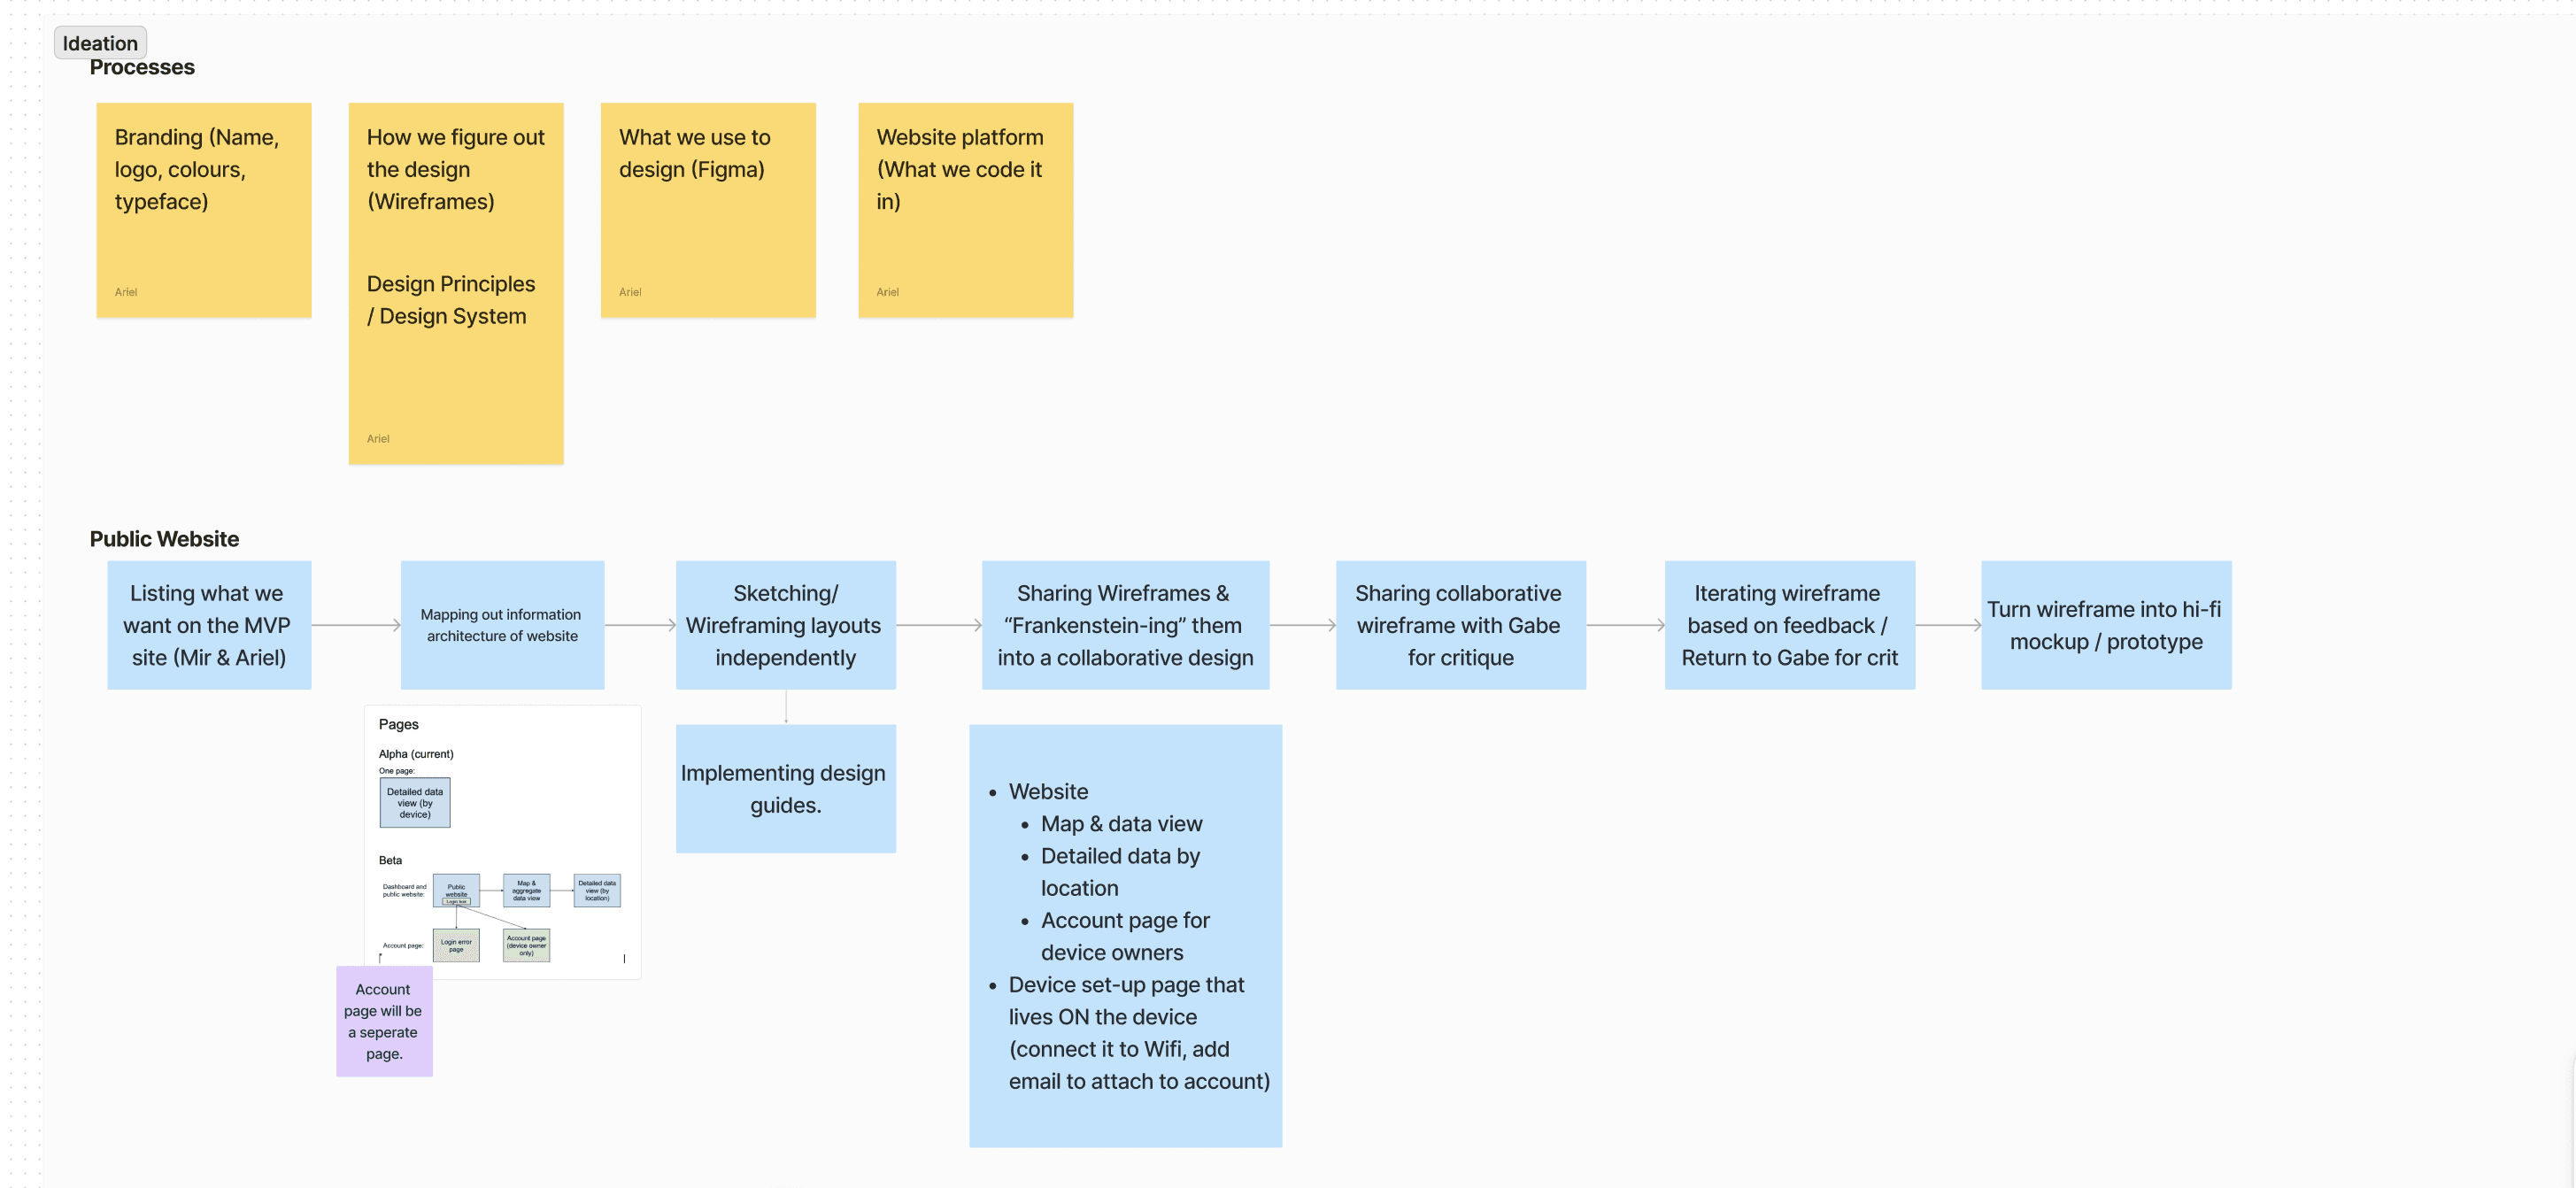
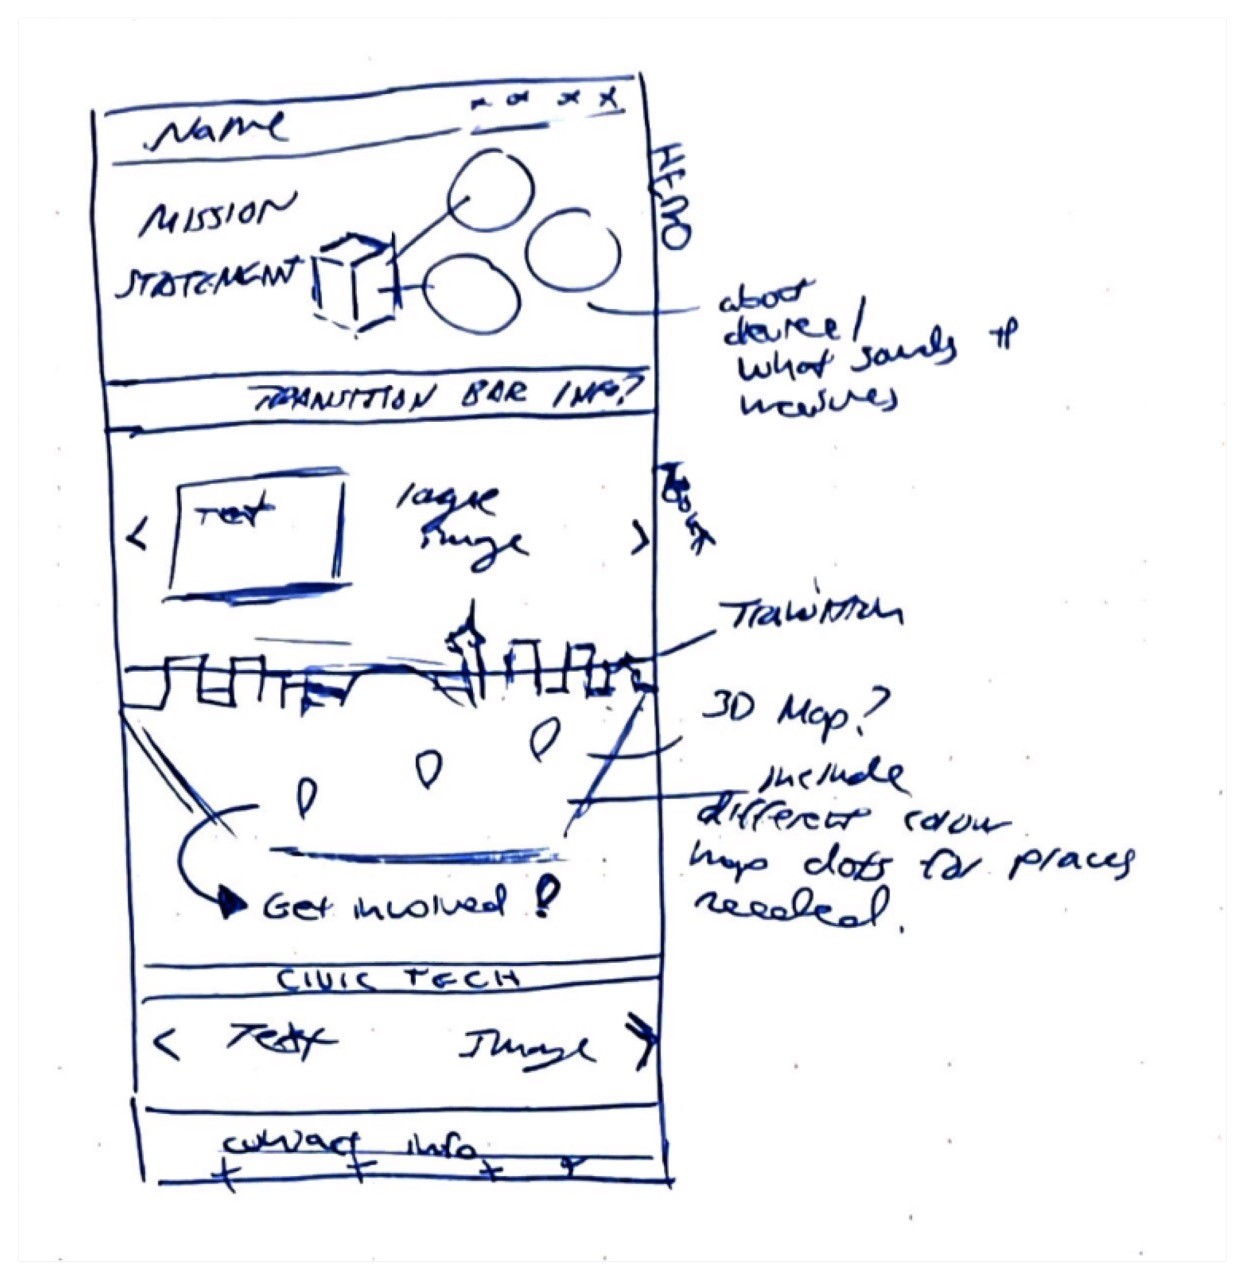
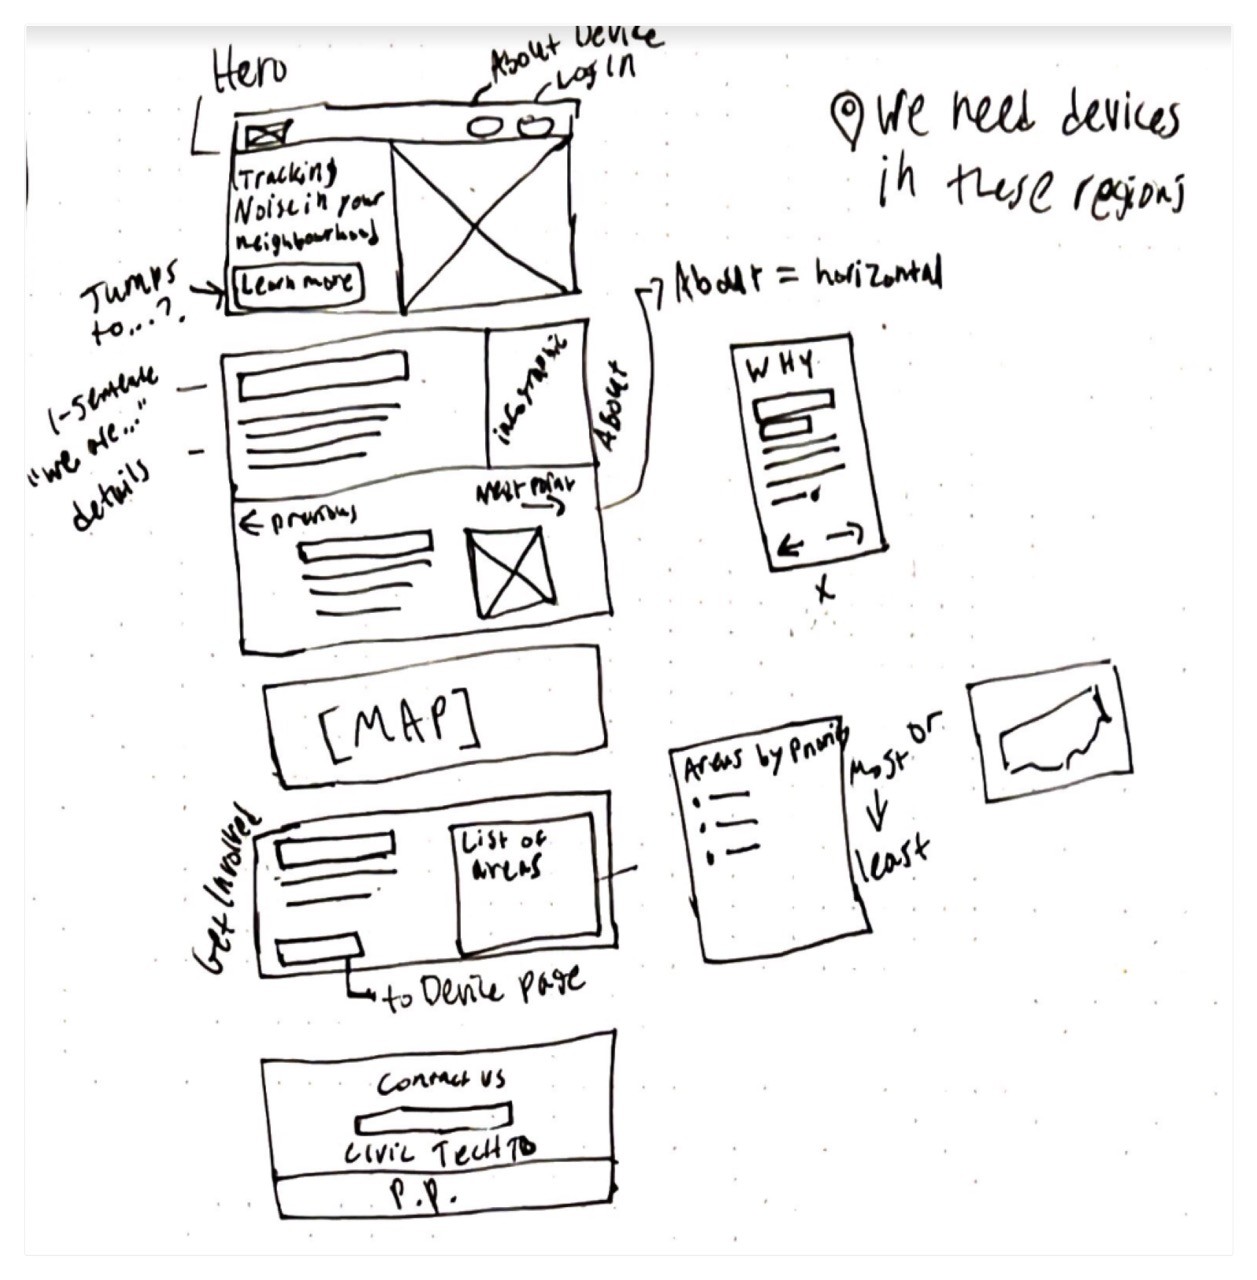
Like all my projects, this one began with pen and paper. After conducting stakeholder interviews, competitor analysis, and gathering insights from advocates, we started sketching ideas on paper.
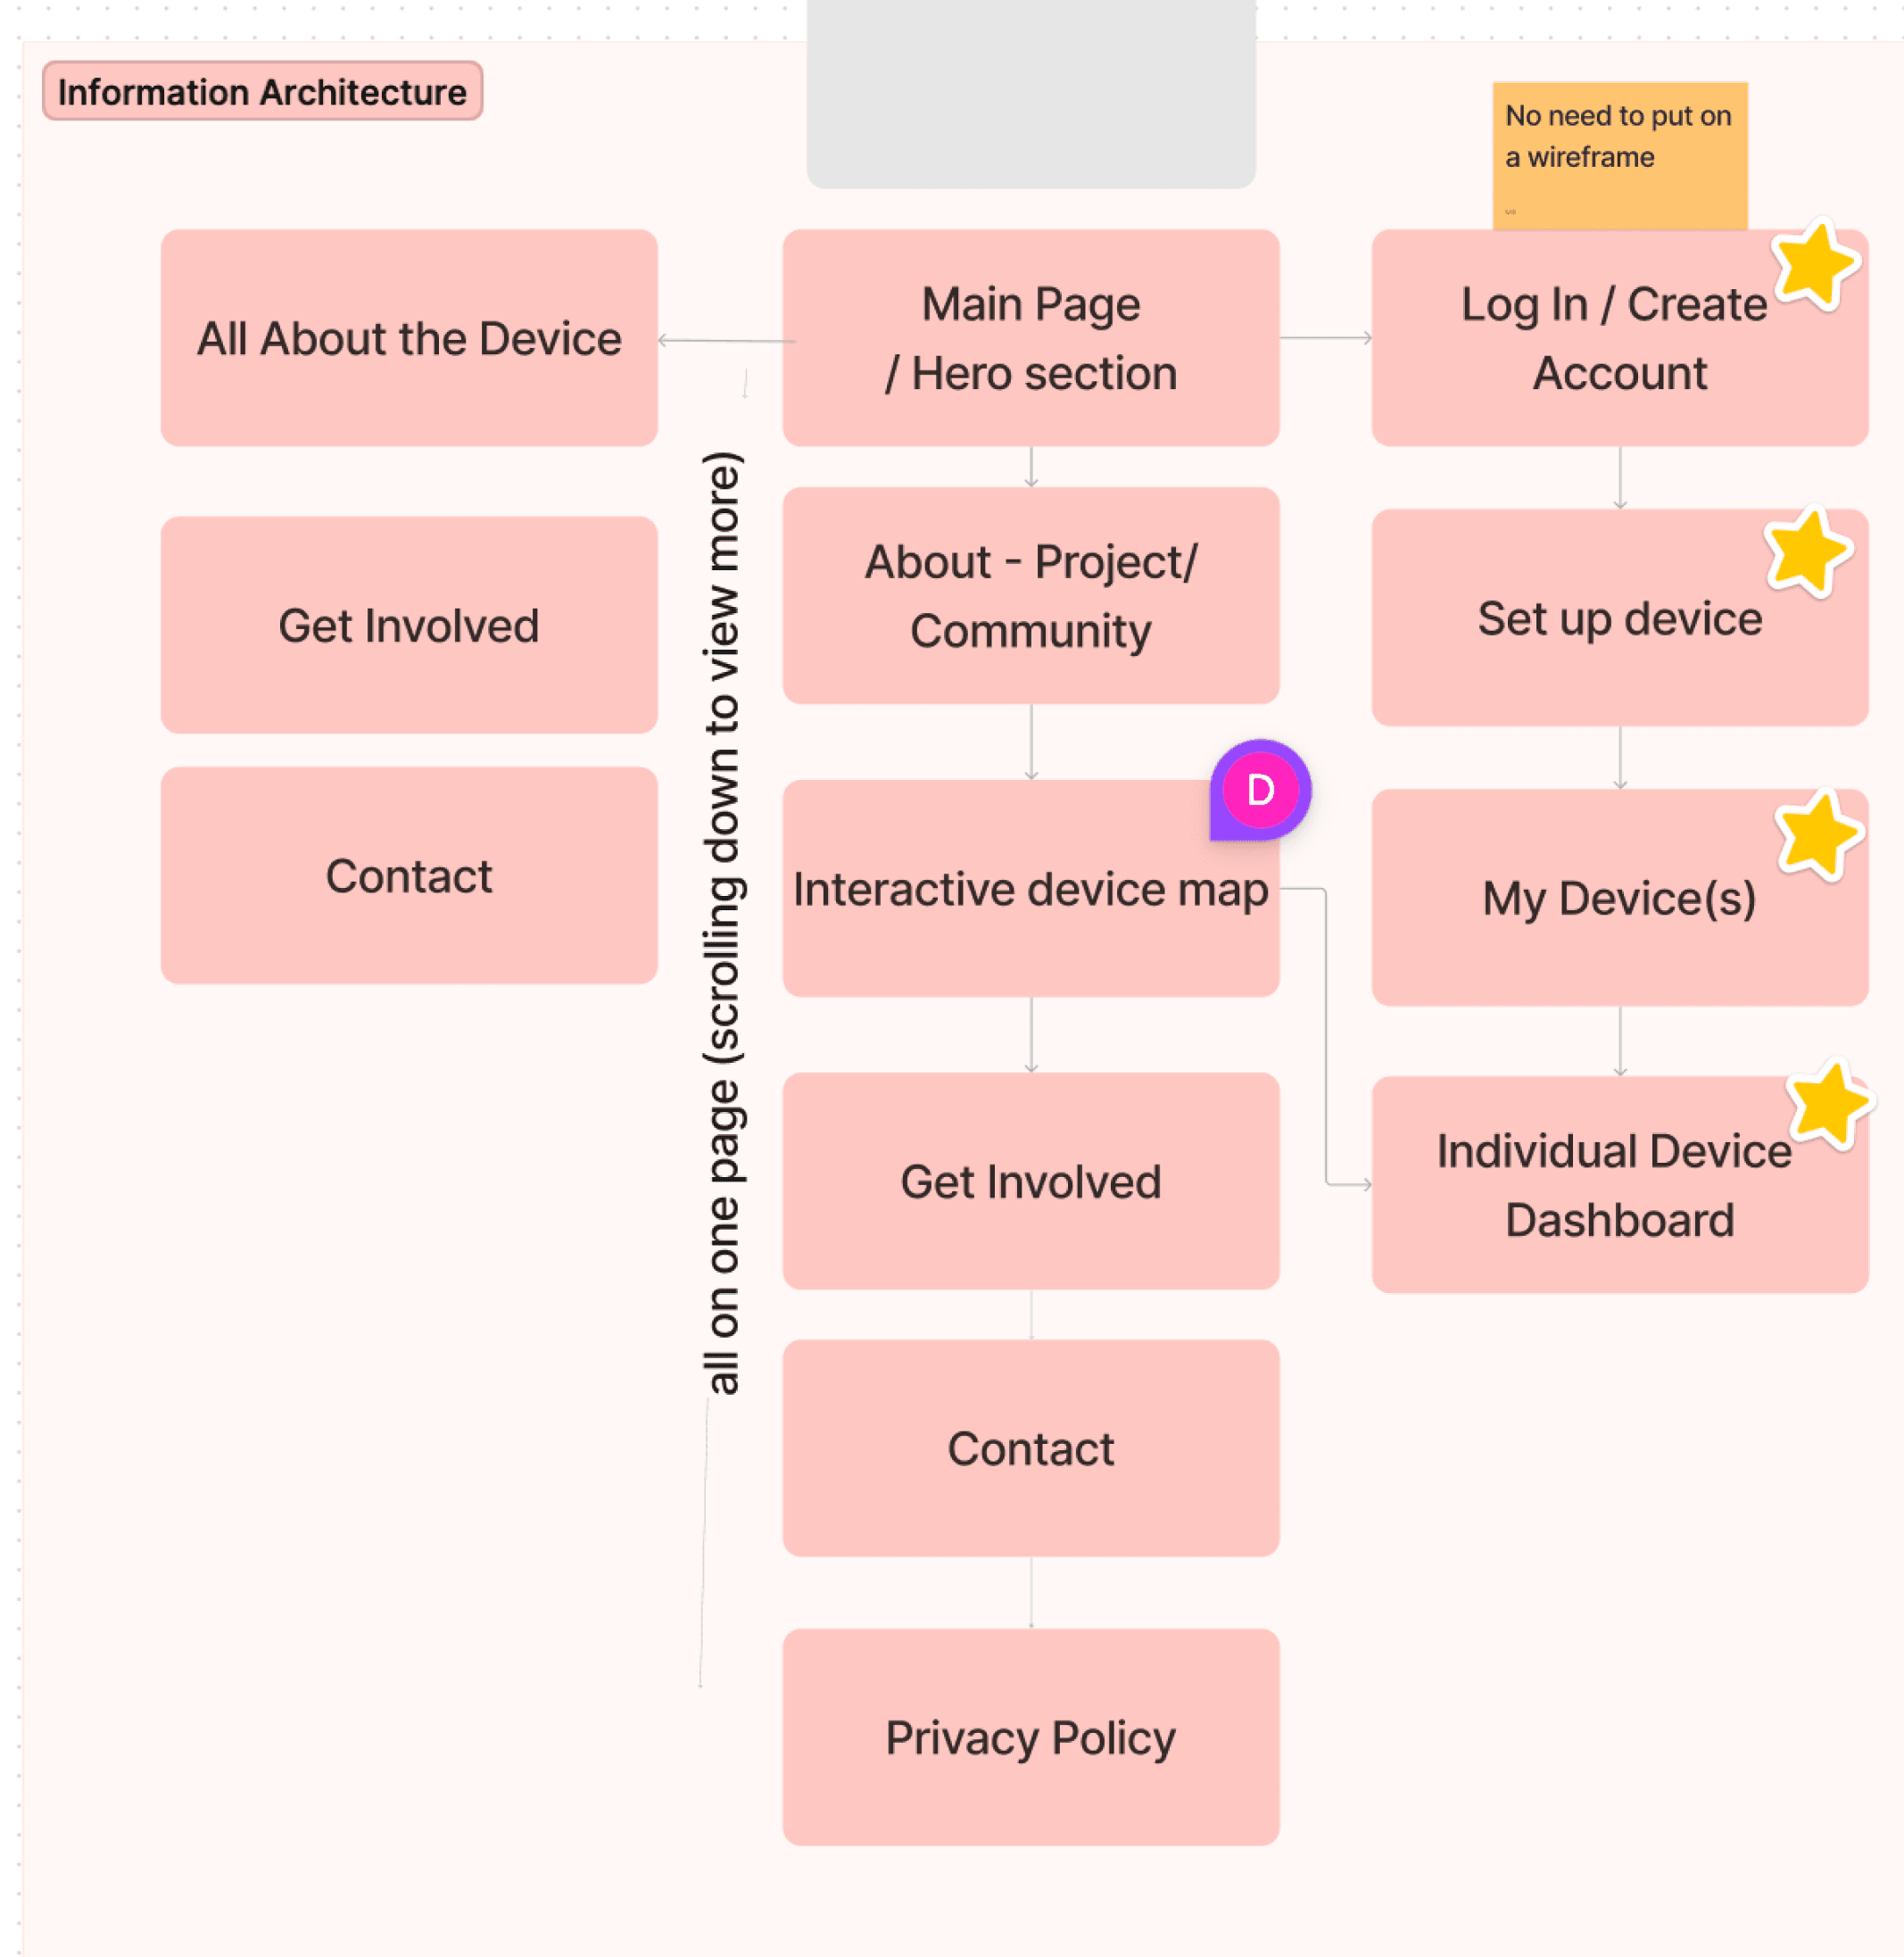
Next, we discussed our priorities for the Minimum Viable Product (MVP) to best achieve our goals and align with user needs. This discussion led us to develop the information architecture and wireframes.
Prototypes
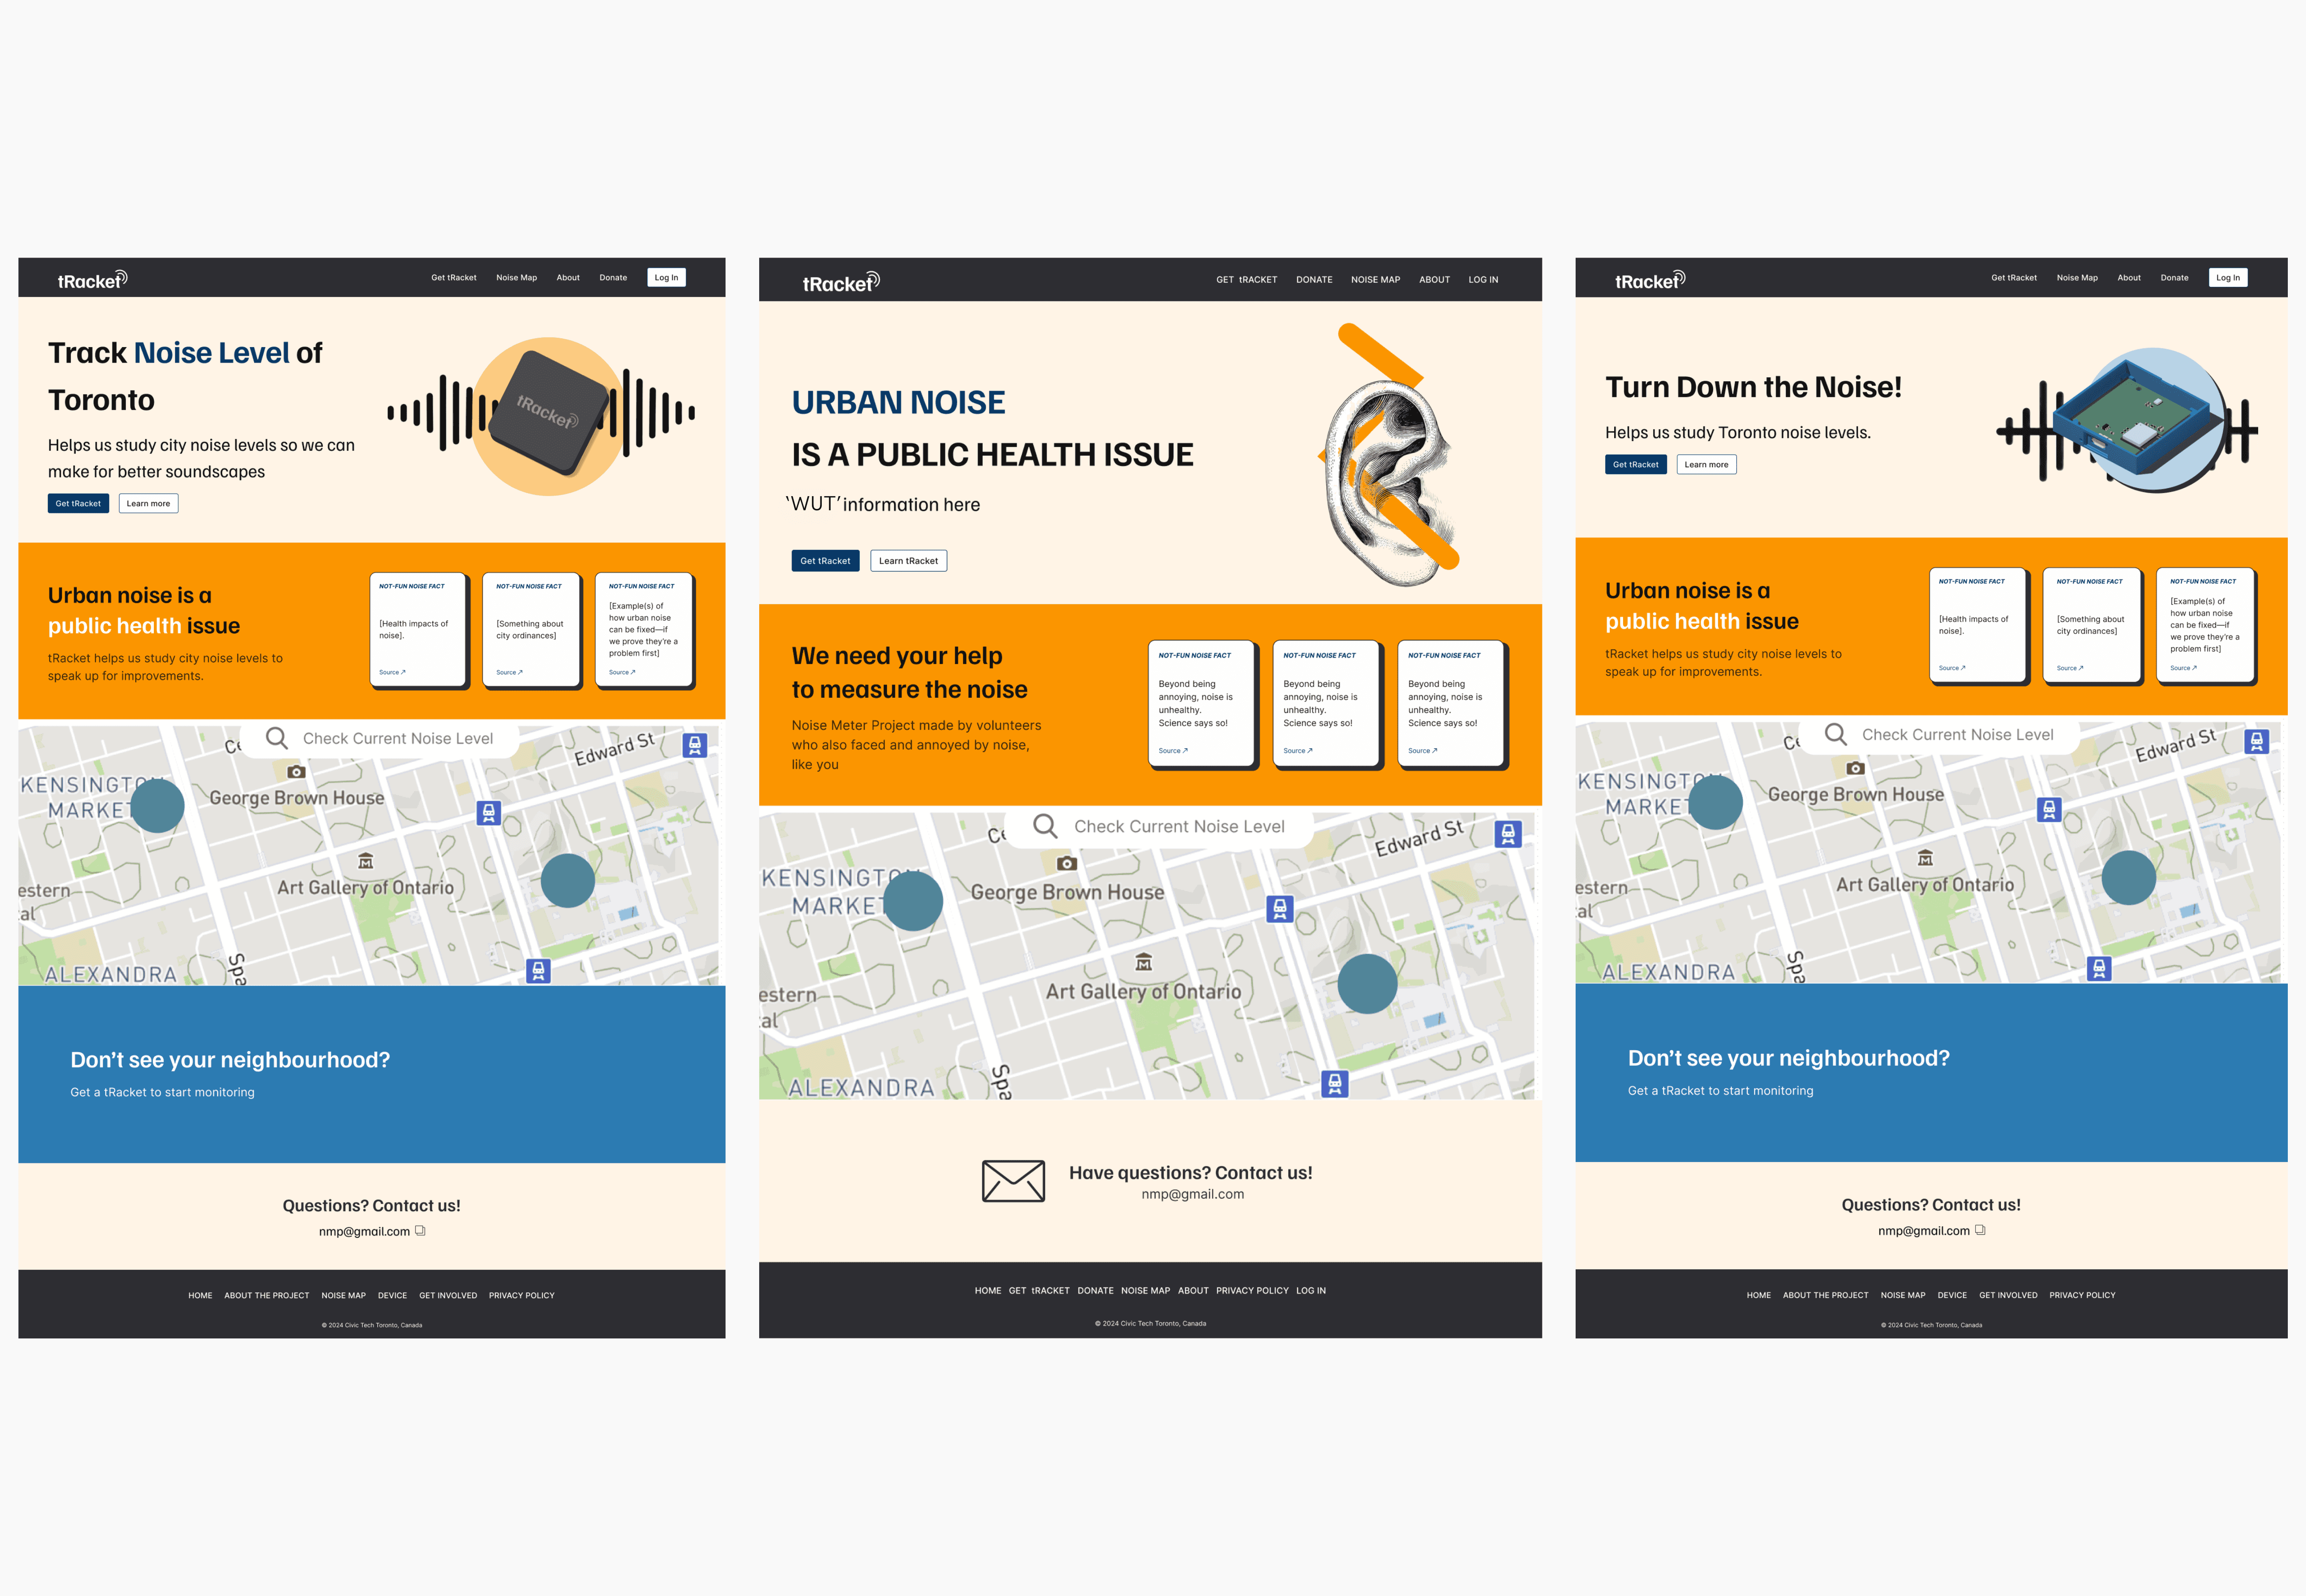
Collaborated with fellow designer to build out different prototype variations.
Variations | Landing Page
Current Noise Level | Device Owners' Page
Location Selection | Sensor Set Up
Learnings
Keeping UX Research Wider
In my global search for noise pollution competitors, I cast a wider net beyond just noise itself. I also explored different types of pollution, such as air and traffic. This comprehensive approach allowed us to examine a broader range of user journeys and user interfaces (UIs), ultimately informing our product decisions.
Hardware Production
Collaborating with system engineers provided me with a close-up view of sensor production. This experience not only expanded my knowledge of UX design but also gave me a valuable understanding of hardware production.
Challenges
MVP First
Our initial goal was to launch a Minimum Viable Product (MVP). To achieve this, we prioritized core features and deferred some enhancements.
Once the MVP has been successfully launched, we plan to implement additional features such as a contact form, better device sign in UI and richer data visualizations, which will be possible with the deployment of more sensors.
Compramises
Due to our limitations as a volunteer group, we had to make some compromises. In some cases, this meant using less data than ideal and relying on assumptions. To mitigate this, I extensively incorporated UX research findings into the design process.
Once MVP is launched, outcomes will be available.
Questions?

